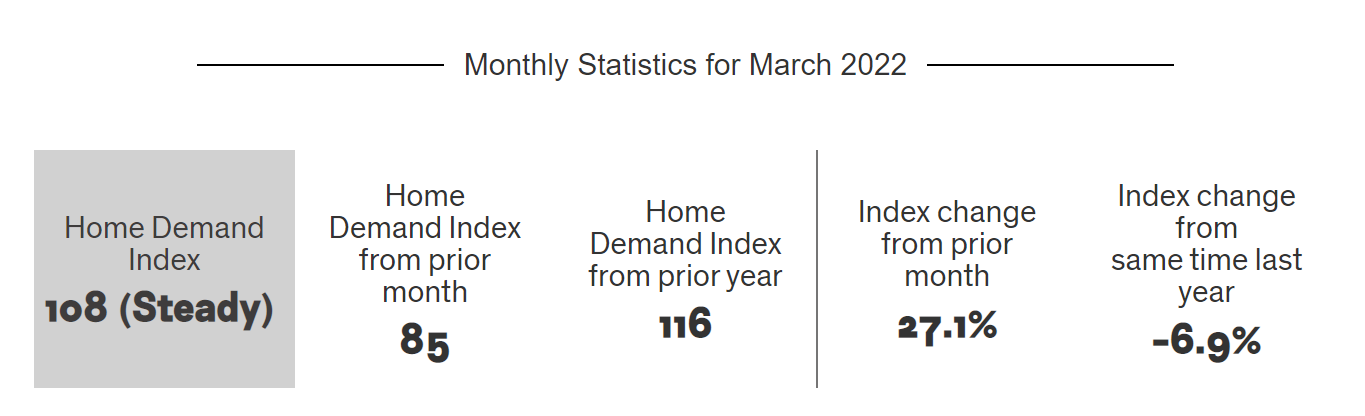
The Bright MLS | T3 Home Demand Index for the Washington Metro area increased by slightly more than 27 percent in February to 108. Buyer interest was at a Steady pace over the month compared with Slow demand in January.
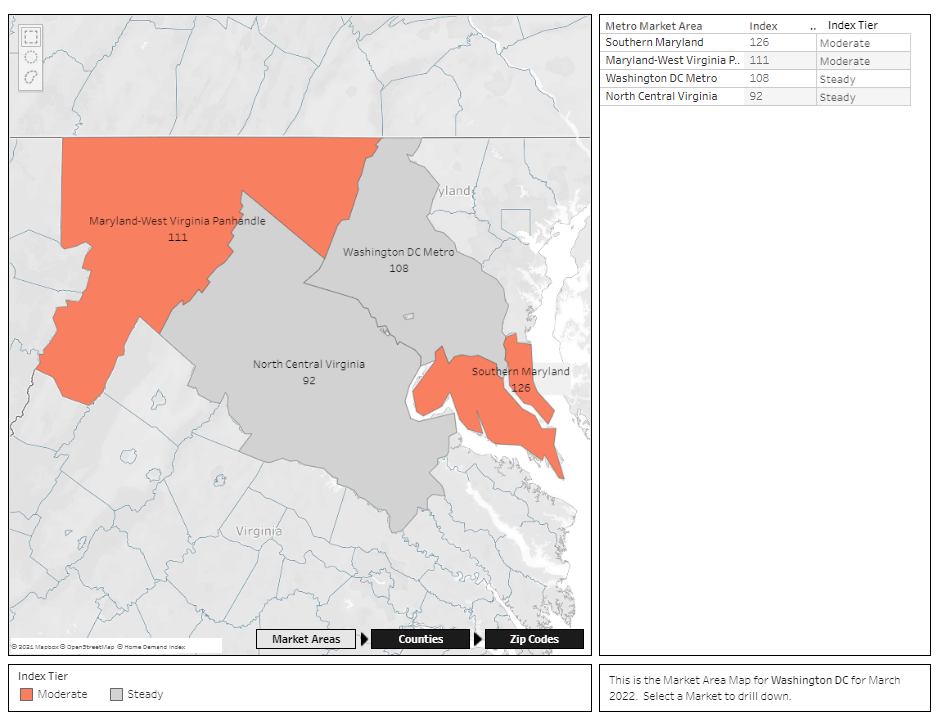
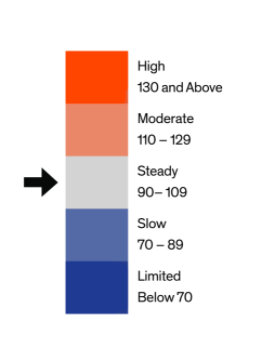
The market trend line, below, provides a high-level monthly overview of the Home Demand Index for each of the metro market areas within the Greater Washington D.C. Metro Area. The Home Demand Index is baselined at 100, with 90-110 indicating a steady market. Index values above 110 indicate moderate and high activity while Index values below 90 indicate slower or limited activity. For more information for a given period of time, click on any point on the map to pull up the monthly report.

Each of the market areas listed above are defined as follows:
- Maryland-West Virginia Panhandle – Allegany, MD; Berkeley, WV; Garrett, MD; Grant, WV; Hampshire, WV; Hardy, WV; Jefferson, WV; Mineral, WV; Morgan, WV; Pendleton, WV; Washington, MD;
- North Central Virginia – Caroline, VA; Clarke, VA; Culpeper, VA; Fauquier, VA; Frederick, VA; Fredericksburg City, VA; King George, VA; Madison, VA; Manassas City, VA; Orange, VA; Page, VA; Prince William, VA; Rappahannock, VA; Shenandoah, VA; Spotsylvania, VA; Stafford, VA; Warren, VA; Winchester City, VA;
- Southern Maryland – Calvert, MD; Charles, MD; Saint Marys, MD;
- Washington D.C. Metro – Alexandria City, VA; Arlington, VA; Fairfax, VA; Falls Church City, VA; Frederick, MD; Loudoun, VA; Montgomery, MD; Prince Georges, MD; Washington, DC;
Home Demand Index
The Bright MLS | T3 Home Demand Index for the Washington Metro area increased by slightly more than 27 percent in February to 108. Buyer interest was at a Steady pace over the month compared with Slow demand in January.
In February, the Index rose for each type of home with the greatest increases in mid- and higher-priced single-family homes. Demand was strongest for higher-priced single-family homes and higher-priced condos, each with a high level of buyer interest. Overall, inventory conditions were tighter in February compared with January. The monthly supply decreased for higher-priced single-family homes, condos and townhouses. Inventory levels ranged from a one-month supply for townhouses and mid-priced single-family homes to a 2.5 months supply for higher-priced condos.
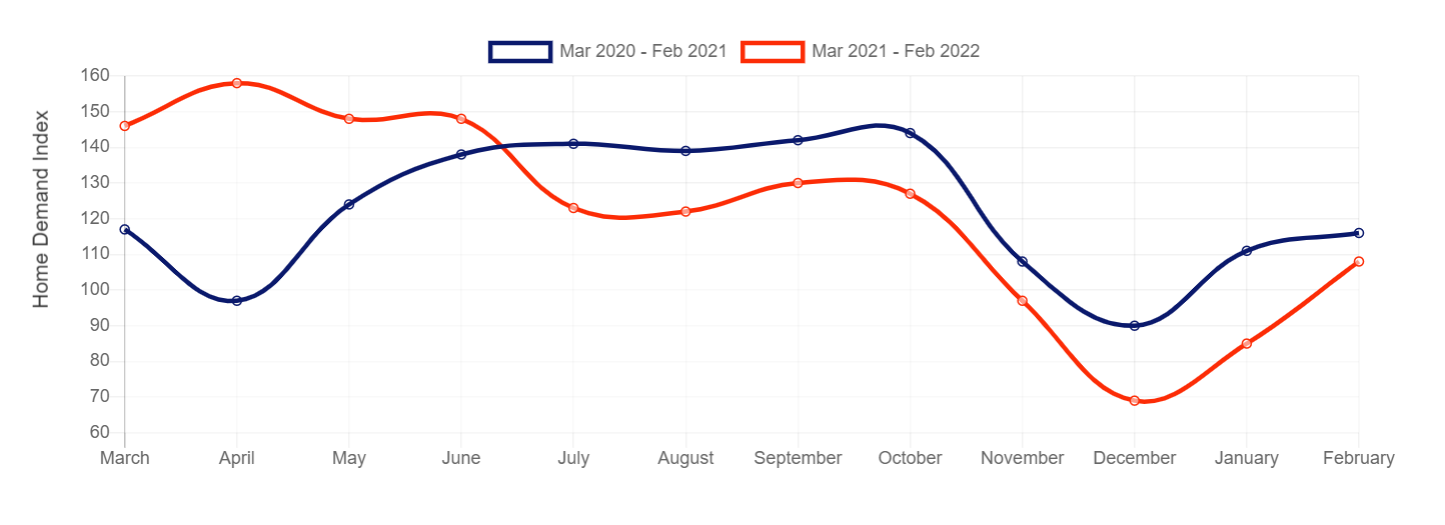
| Home Demand Index | Historical Year-over-Year Comparison |
Home Demand Map
Buyer interest in Arlington County and Alexandria City homes remained in the High category in February. Demand was Moderate in Fairfax and Prince Georges counties. Other counties in the Washington Metro area recorded buyer demand ranging from Steady in Loudoun and Montgomery counties to Limited in Falls Church City. Demand was Moderate in Southern Maryland and the Maryland-West Virginia Panhandle market area and Steady in the North Central Virginia region. Across the Greater Washington area, demand in 27 percent of ZIP codes was in the High range compared with 16 percent in January. At the same time, the share of ZIP codes with Limited demand fell from 47 percent in January to 37 percent in February.