


DC Metro Area Market Overview
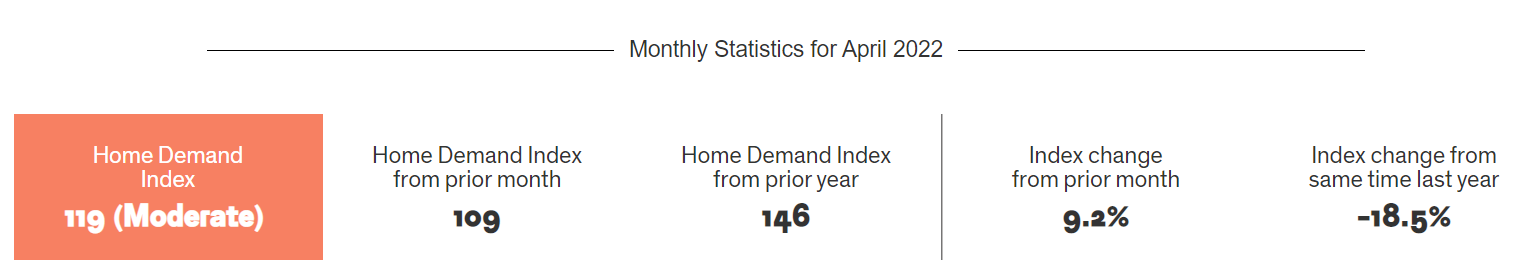
The Bright MLS | T3 Home Demand Index for the Washington Metro area increased by 9.2 percent in March to 119, reflecting a Moderate level of buyer interest. Demand in February was Steady.
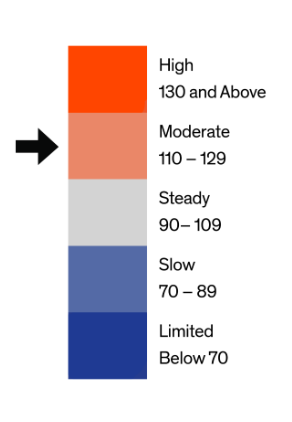
The market trend line, below, provides a high-level monthly overview of the Home Demand Index for each of the metro market areas within the Greater Washington D.C. Metro Area. The Home Demand Index is baselined at 100, with 90-110 indicating a steady market. Index values above 110 indicate moderate and high activity while Index values below 90 indicate slower or limited activity. For more information for a given period of time, click on any point on the map to pull up the monthly report.
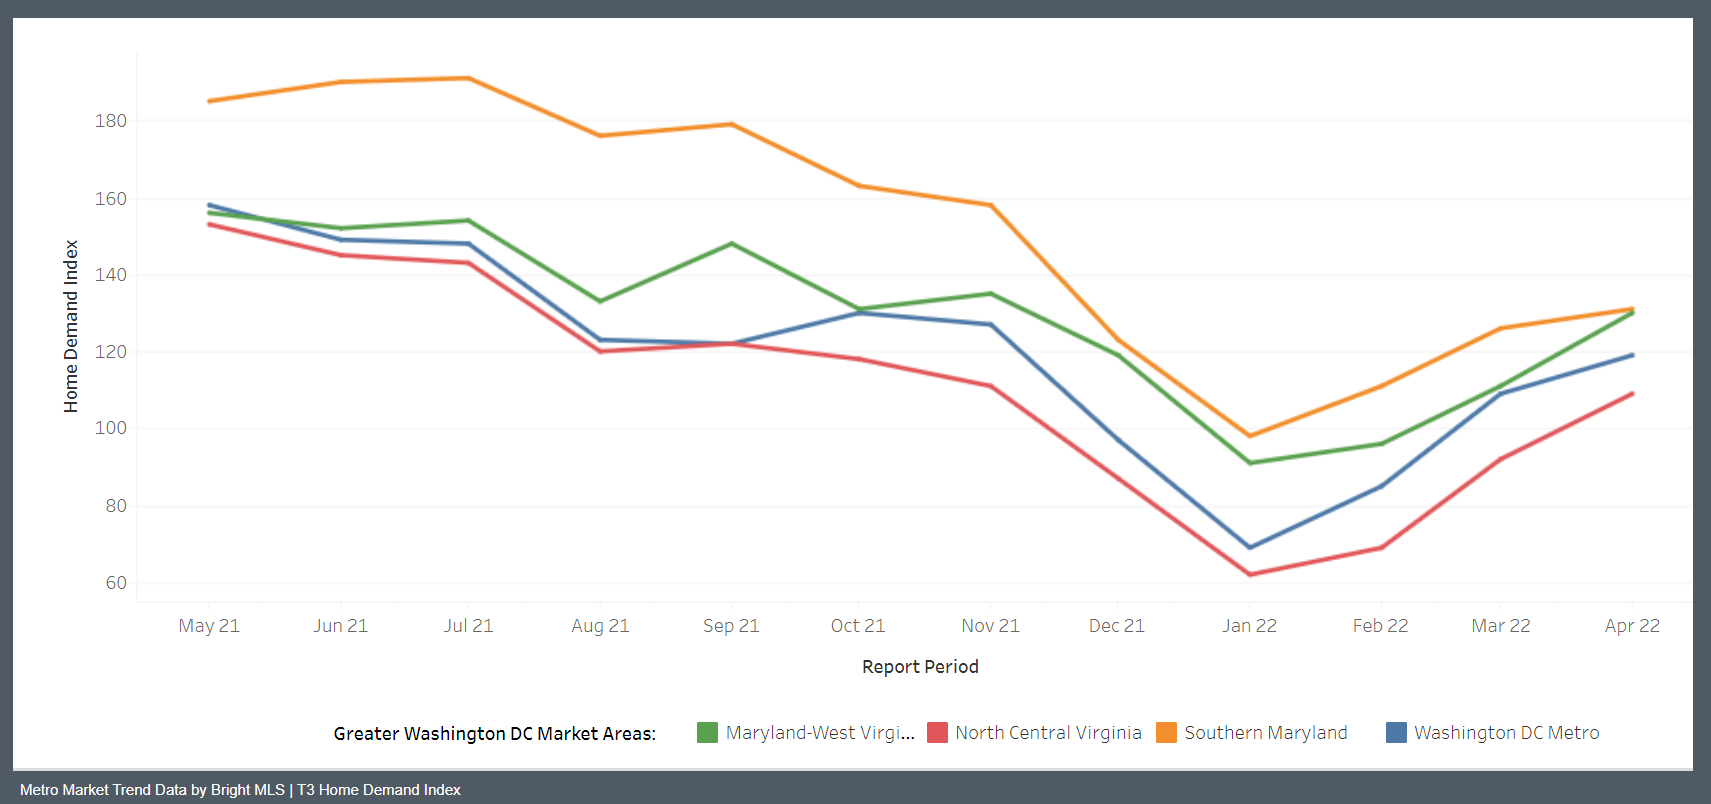
Each of the market areas listed above are defined as follows:
- Maryland-West Virginia Panhandle – Allegany, MD; Berkeley, WV; Garrett, MD; Grant, WV; Hampshire, WV; Hardy, WV; Jefferson, WV; Mineral, WV; Morgan, WV; Pendleton, WV; Washington, MD;
- North Central Virginia – Caroline, VA; Clarke, VA; Culpeper, VA; Fauquier, VA; Frederick, VA; Fredericksburg City, VA; King George, VA; Madison, VA; Manassas City, VA; Orange, VA; Page, VA; Prince William, VA; Rappahannock, VA; Shenandoah, VA; Spotsylvania, VA; Stafford, VA; Warren, VA; Winchester City, VA;
- Southern Maryland – Calvert, MD; Charles, MD; Saint Marys, MD;
- Washington D.C. Metro – Alexandria City, VA; Arlington, VA; Fairfax, VA; Falls Church City, VA; Frederick, MD; Loudoun, VA; Montgomery, MD; Prince Georges, MD; Washington, DC;
Home Demand Index
The Bright MLS | T3 Home Demand Index for the Washington Metro area increased by 9.2 percent in March to 119, reflecting a Moderate level of buyer interest. Demand in February was Steady.
The Index rose for each type of home in March, except for lower-priced single-family. The greatest increases in the Index were in the mid- and higher-priced single-family and higher-priced condo segments, with gains between 13 percent and 15 percent over the month. Overall, demand was strongest in the higher-priced single-family and condo segments, each in the High range. Inventory conditions tightened in March with a drop in months supply for each type of home as sales gains further depleted already-low inventory. Inventory levels ranged from a 0.8 months supply for mid-priced single-family homes and townhouses to a two-month supply for higher-priced condos.
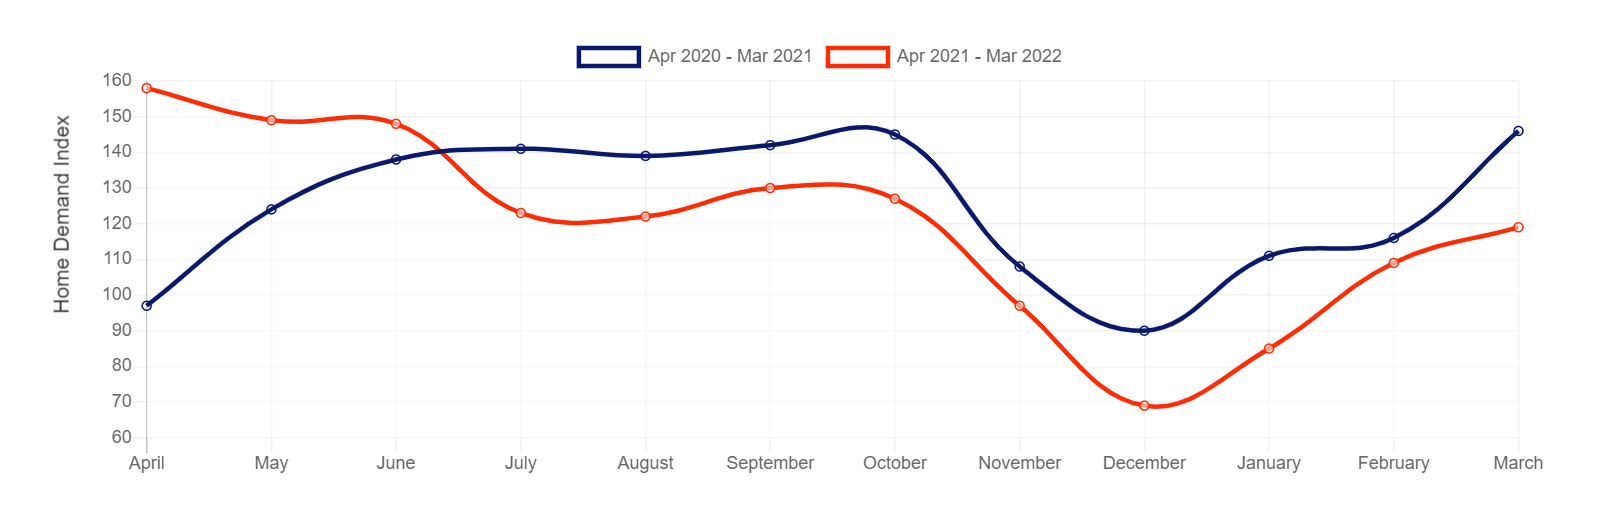
Home Demand Index | Historical Year-over-Year Comparison
Home Demand Map
Buyer interest in Arlington and Fairfax counties and Alexandria City was in the High category in March. Demand was Steady in Montgomery County and Slow in Frederick County and in the Moderate range throughout the rest of the metro area. Demand was High in Southern Maryland and the Maryland-West Virginia Panhandle market area and Steady in the North Central Virginia region. Across the Greater Washington area, demand in one-third of ZIP codes was in the High category, up from 27 percent in February. Buyer interest in roughly one-third of ZIP codes was either Slow or Limited versus one-half of ZIP codes in February.
