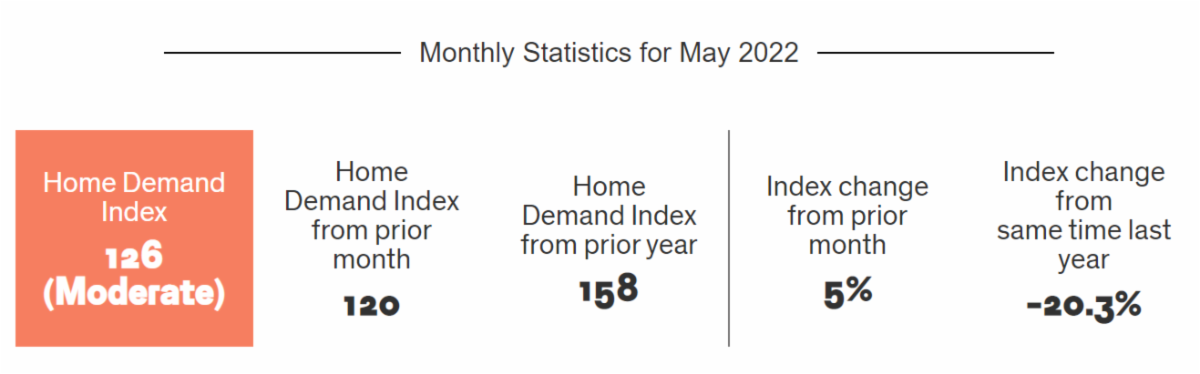
The Bright MLS | T3 Home Demand Index rose five percent to 126 reflecting a Moderate pace of demand for Washington Metro area homes. The Index has risen for four months in a row following a seasonal lower in December.
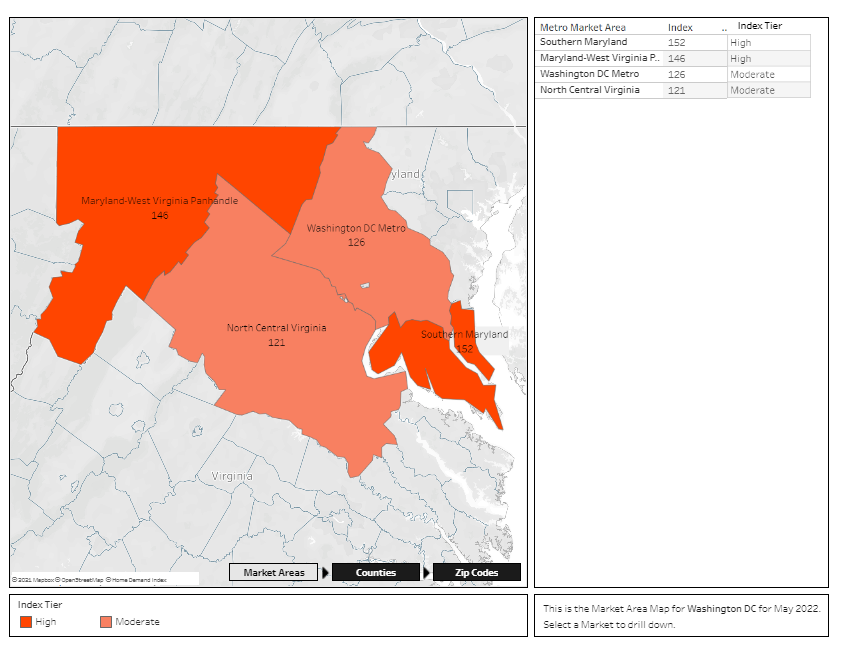
The market trend line, below, provides a high-level monthly overview of the Home Demand Index for each of the metro market areas within the Greater Washington D.C. Metro Area. The Home Demand Index is baselined at 100, with 90-110 indicating a steady market. Index values above 110 indicate moderate and high activity while Index values below 90 indicate slower or limited activity. For more information for a given period of time, click on any point on the map to pull up the monthly report.
Each of the market areas listed above are defined as follows:
Maryland-West Virginia Panhandle – Allegany, MD; Berkeley, WV; Garrett, MD; Grant, WV; Hampshire, WV; Hardy, WV; Jefferson, WV; Mineral, WV; Morgan, WV; Pendleton, WV; Washington, MD;
North Central Virginia – Caroline, VA; Clarke, VA; Culpeper, VA; Fauquier, VA; Frederick, VA; Fredericksburg City, VA; King George, VA; Madison, VA; Manassas City, VA; Orange, VA; Page, VA; Prince William, VA; Rappahannock, VA; Shenandoah, VA; Spotsylvania, VA; Stafford, VA; Warren, VA; Winchester City, VA;
Southern Maryland – Calvert, MD; Charles, MD; Saint Marys, MD;
Washington D.C. Metro – Alexandria City, VA; Arlington, VA; Fairfax, VA; Falls Church City, VA; Frederick, MD; Loudoun, VA; Montgomery, MD; Prince Georges, MD; Washington, DC;
Home Demand Index
The Bright MLS | T3 Home Demand Index rose five percent to 126 reflecting a Moderate pace of demand for Washington Metro area homes. The Index has risen for four months in a row following a seasonal lower in December.
Demand rose for all types of homes, except lower-priced single-family, with the greatest increase in buyer interest in higher-price single-family homes. Inventory conditions changed little over the month. The months supply ranged from 0.8 months supply for mid-priced single-family homes to 1.9 months supply for higher-priced condos.
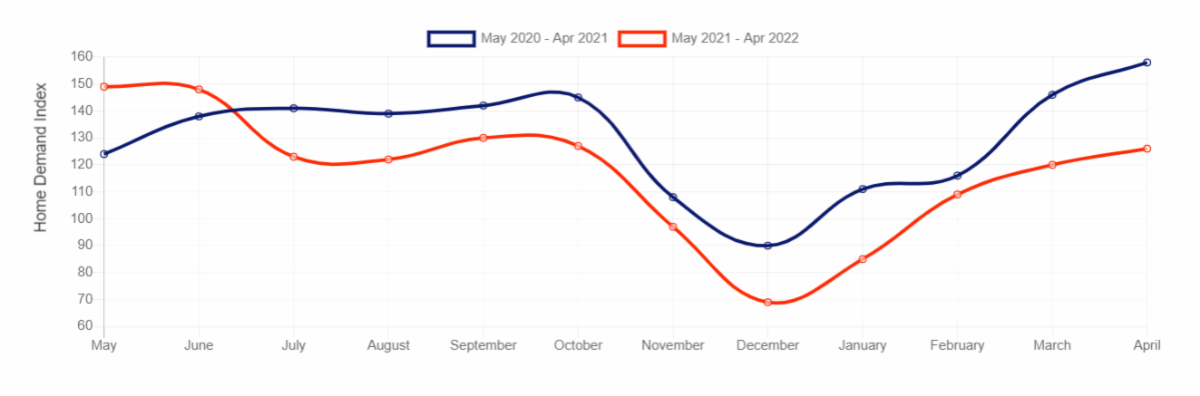
| Home Demand Index | Historical Year-over-Year Comparison |
Although demand has risen each month during the spring homebuying market, the Index has remained below the level one year earlier. Demand has increased more slowly during the past two months in particular. As a result, the April Index was 20 percent below the level one year earlier. Higher mortgage rates, decreased affordability and limited inventory have all contributed to lower demand this spring compared with last spring.

Home Demand Map
In the Washington Metro area, buyer interest in Arlington, Fairfax and Loudoun counties and Alexandria City was in the High category in April. Demand was Moderate in Falls Church City, Montgomery County and Prince Georges counties along with the District of Columbia. Across the Greater Washington area, demand was High in Southern Maryland and the Maryland-West Virginia Panhandle market area and Moderate in the North Central Virginia region. In 38 percent of ZIP codes, demand was in the High range, a marginally higher percentage that the previous month. Forty percent of ZIP codes recorded Slow or Limited demand, virtually unchanged from March.