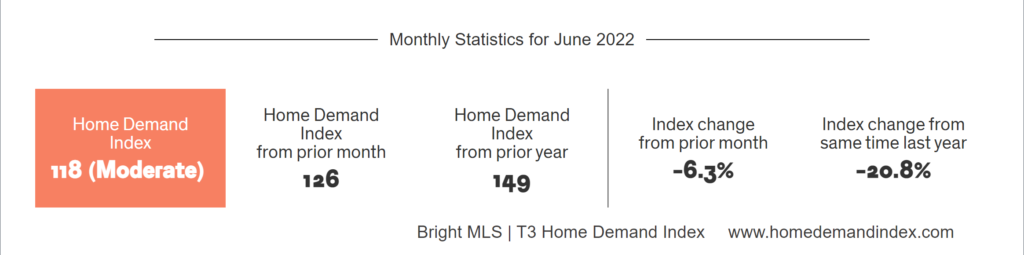
Home demand in the Washington Metro area softened in May as reflected by a 6.3 percent decrease in the Bright MLS | T3 Home Demand Index. Although down over the month, demand remained in the Moderate range. Demand was High one year earlier.
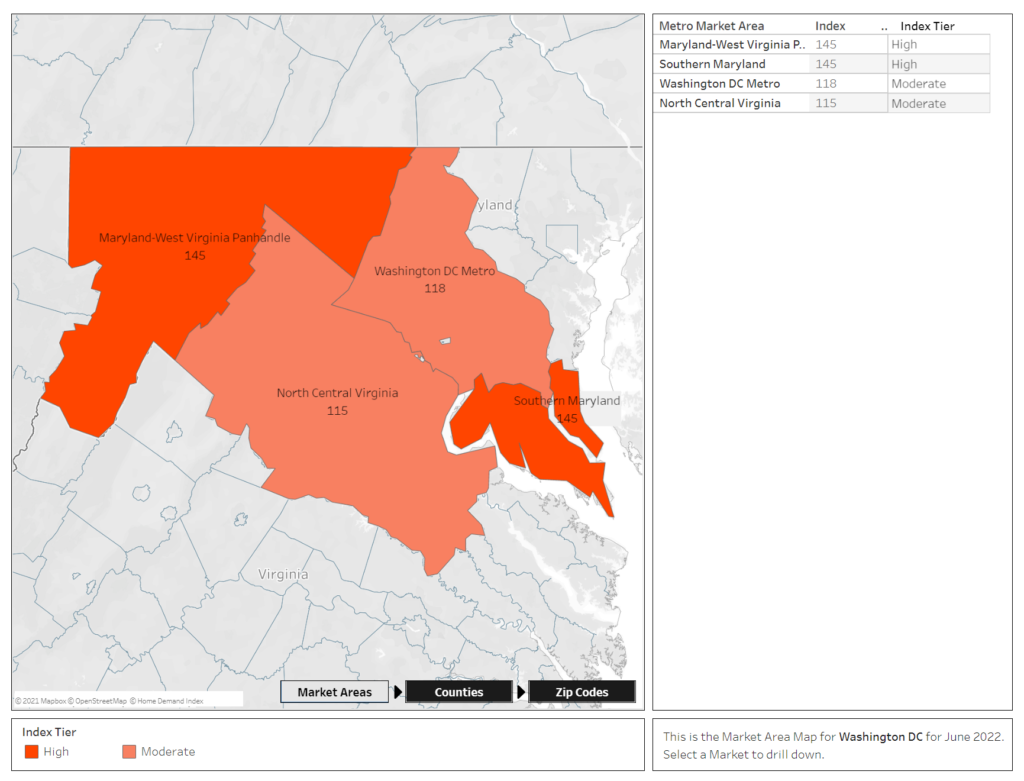
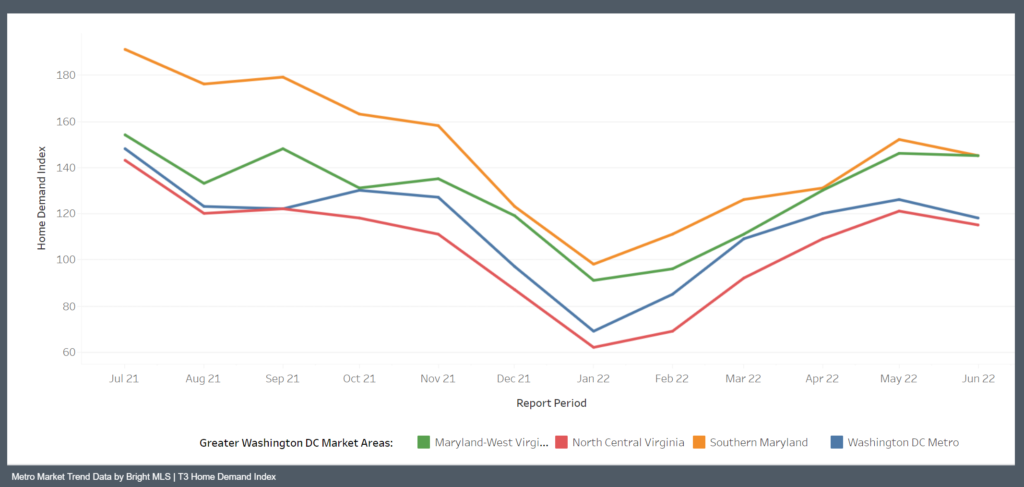
The market trend line, below, provides a high-level monthly overview of the Home Demand Index for each of the metro market areas within the Greater Washington D.C. Metro Area. The Home Demand Index is baselined at 100, with 90-110 indicating a steady market. Index values above 110 indicate moderate and high activity while Index values below 90 indicate slower or limited activity. For more information for a given period of time, click on any point on the map to pull up the monthly report.
Each of the market areas listed above are defined as follows:
Maryland-West Virginia Panhandle – Allegany, MD; Berkeley, WV; Garrett, MD; Grant, WV; Hampshire, WV; Hardy, WV; Jefferson, WV; Mineral, WV; Morgan, WV; Pendleton, WV; Washington, MD;
North Central Virginia – Caroline, VA; Clarke, VA; Culpeper, VA; Fauquier, VA; Frederick, VA; Fredericksburg City, VA; King George, VA; Madison, VA; Manassas City, VA; Orange, VA; Page, VA; Prince William, VA; Rappahannock, VA; Shenandoah, VA; Spotsylvania, VA; Stafford, VA; Warren, VA; Winchester City, VA;
Southern Maryland – Calvert, MD; Charles, MD; Saint Marys, MD;
Washington D.C. Metro – Alexandria City, VA; Arlington, VA; Fairfax, VA; Falls Church City, VA; Frederick, MD; Loudoun, VA; Montgomery, MD; Prince Georges, MD; Washington, DC;
Home Demand Index
Home demand in the Washington Metro area softened in May as reflected by a 6.3 percent decrease in the Bright MLS | T3 Home Demand Index. Although down over the month, demand remained in the Moderate range. Demand was High one year earlier.
Demand for all types of homes in the Washington Metro area decreased in May. The largest declines were in the lower-priced condo and townhouse segments each with a 10 percent decrease over the month. Demand for homes in May was strongest for higher-priced single-family homes and for higher-priced condos each with Index in the High range. Buyer interest was Limited for lower-priced single-family homes and Moderate for other segments of the market. The months supply of inventory rose marginally for each market segment in May compared with the previous month. Inventory levels ranged from a 0.9 months supply for mid-priced single-family homes to 2.3 months supply for higher-priced condos.
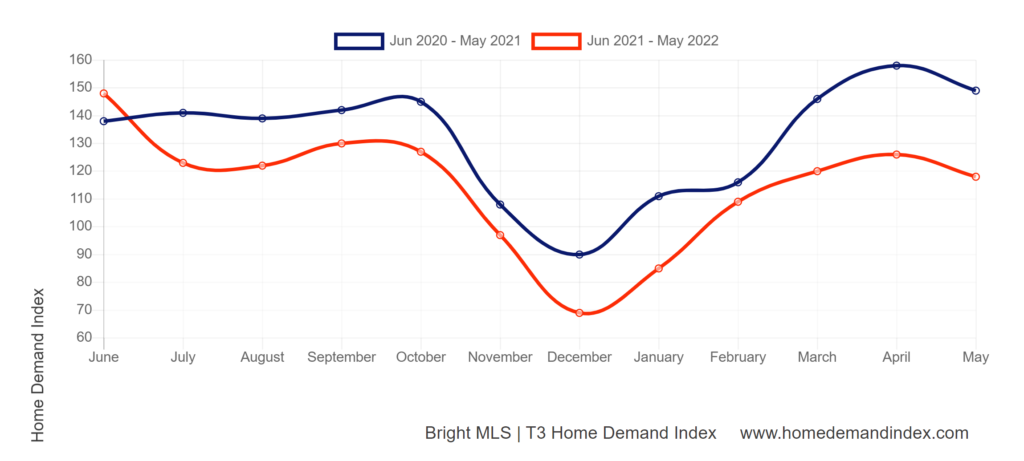
| Home Demand Index | Historical Year-over-Year Comparison |
Following four months of rising demand for Washington Metro area homes, buyer interest decreased in May. Compared with last year, overall demand has been lower this spring largely due to rising mortgage rates, continued increases in home prices and the impact of consumer price inflation on the budgets of would-be home buyers. In May, the Index was nearly 21 percent lower than one year earlier.
Home Demand Map
Demand for homes in Arlington, Fairfax and Loudoun counties and Alexandria City and Falls Church City was in the High category in May. Buyer interest was Steady elsewhere in the metro area. Demand was High in Southern Maryland and the Maryland-West Virginia Panhandle market areas and Moderate in the North Central Virginia region. Across the Greater Washington region, 38 percent of ZIP codes recorded a High level of demand, unchanged from April. Demand in 40 percent of ZIP codes was Slow or Limited, again, unchanged from the previous month.